
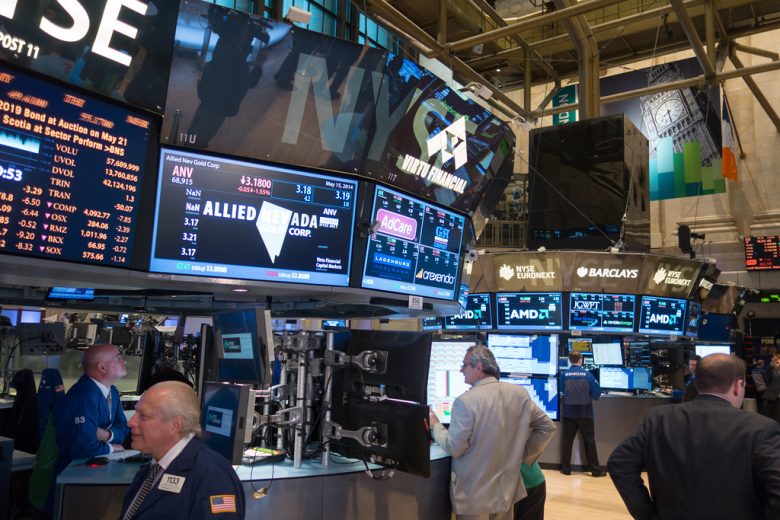
- Move. Gold fell 0.9 percent to $4,140 on October 2 — its fifth weekly loss in six — despite a September payrolls report that came in at just 29,000 new positions, roughly a quarter of what consensus expected.
- Mechanism. Treasury yields initially fell on the weak data, briefly lifting gold, but then recovered into positive territory by afternoon, pulling the 10-year yield back toward 5.26 percent and undercutting the safe-haven bid.
- Level watch. Analysts at Kitco note that a sustained break below $4,000 would mark the first time gold has traded below that level since June, and could accelerate flows toward the $3,900 area if the dollar remains near a 17-month high.
Gold ended Friday, October 2, at approximately $4,140 per troy ounce, down roughly 0.9 percent on the day. The decline came despite a September non-farm payrolls report that, on the surface, looked like it should have supported the metal: the US economy added only 29,000 positions last month, the weakest reading since early 2024, while the prior two months were revised down by a combined 60,000 jobs. Unemployment ticked up to 4.2 percent.
Why Gold Couldn’t Hold a Rally
The initial market reaction played out as gold bulls might have hoped: Treasury yields fell in the minutes after the 8:30 a.m. release, the dollar softened slightly, and gold moved up from its pre-release position. But by mid-morning the move had reversed. Long-end yields — more sensitive to inflation expectations than to near-term growth — climbed back into positive territory, with the 10-year pushing toward 5.26 percent. The US dollar index held near a 17-month high, and gold surrendered its intraday gain.
The dynamic illustrates a tension that has defined gold’s trading range this autumn. Weak employment data reduces the probability of further Federal Reserve tightening, which in theory should support gold. But the same data is also being read by bond markets as evidence that the US economy is cooling into a higher-for-longer inflation environment — one in which real yields stay elevated and the dollar stays firm. That combination is historically unfriendly for non-yielding assets.
The Pattern Since August
Gold has now fallen in five of the past six weeks, losing roughly 6 percent from its recent high near $4,401 — a level it tested in August when August payrolls cemented Fed hike bets. The metal has also struggled to regain momentum after Fed rate hike odds climbed to 87 percent in mid-September pushed it below $4,401.
WTI crude oil also fell, settling around $91 per barrel as Middle East shipping routes showed signs of stabilisation following months of disruption. The softer oil price, combined with the weak jobs data, reduced headline inflation expectations at the margin — but not enough to dislodge the bond market’s conviction that the Fed will need to hold rates higher for longer into 2027.
What to Watch
The Federal Reserve’s next rate decision is several weeks away. Between now and then, the CPI reading for September and the core PCE deflator for August — both due in the coming two weeks — will be the key data points. If those prints land above expectations, pressure on gold is likely to intensify. A clean break below $4,000 would mark the end of the metal’s year-long range and shift analyst attention toward whether the broader commodity bull market remains intact.